Traders use moving averages to show them where market trends are going and ride on it. On the other hand, Fibonacci ratios exist everywhere in nature, including the markets.
Traders use ratios to identify areas of interest that act as support and resistance levels.
When you combine this indicator with the Fibonacci technical indicator, you get an accurate Fibonacci-based Moving Averages. This determines the trend and can help you identify entry & exit points.
The indicator has five exponentially weighted moving averages with Fibonacci ratios and is applicable to any trading instrument. The best part is, you can use it to trade on higher time frames as well.
Buy and Sell Signals
The best time to buy is on periods where the short line of the moving average crosses above the long term lines.
When the short-term moving average line crosses the long-term line, you should be selling.
Exit Strategies
Place your stop loss either above the high or below the low of the recent swing
Place your take-profit target above the next key resistance or support level
Conclusion
Without a doubt in my mind, Fibonacci is one of the best tools for technical analysis. Using Fibonacci’s ratios to calculate moving averages is probably one of the best ideas for trading out there.
The G-Pivot indicator for Mt4 is a forex indicator that finds and plots key pivot points, points that show the balance of supply and demand at a given time.
These levels represent dynamic support and resistance, where the price of an asset is likely to reverse.
The indicator is integrated with a mathematical algorithm that tracks previous pivot points of the price and projects them onto your chart.
We have a wealth of experience and expertise in the trading industry. For example, our gPivot ResSup indicator is useful for novice, intermediate as well as experienced traders. This indicator can be used by different types of traders including scalpers, day/intraday traders or swing traders.
BUY Setup: A bullish trend is one in which prices are increasing, such as going up the page. Using this type of trade, you would wait for the price to retrace and find support on the indicator. This signifies an opportunity to enter a BUY/LONG trade (e.g. bullish engulfing).
SELL Setup: First we need to identify the trend of the market; in this case, a bearish trend. Next we wait for the price to retrace and react to the resistance level (red lines) of a certain indicator. We then open a SELL/SHORT position using price action. (e.g. bearish engulfing, inverted hammer, etc.).
Conclusion
The gPivot ResSup indicator is a tool that helps to identify important reversal zones for the price. You can download it for free.
The ATR Bands indicator is a volatility-based indicator that incorporates the Average True Range (ATR) to measure the significance of it in the market.
This technical indicator would be handy as a volatility detector- it would tell you when there is high/low volatility. It would also be good for trend analysis and searching for reversal points.
Though the indicator looks somewhat like typical Bollinger Bands, it uses a different function. The bands represent the higher and lower range of the price and are calculated with averages. Therefore,
Candles with ATR bands are much better for trading than candlesticks with a Bollinger Band because they combine volatility analysis with trade entry and exit points. This is better than just backtesting to find fairs points
Furthermore, traders of all levels are able to use the indicator. More than that, it’s a useful instrument for novice, intermediate and advanced traders. This indicator can be used for different trading styles such as scalping day/intraday trades and swing trading
BUY Signal: Firstly, wait for the price to swing down to the lower band of the indicator, then watch out for a price rejection upwards. With this condition, you may open a BUY/SELL position after another bullish reversal candlestick pattern (e.g. bullish engulfing).
SELL Signal: First, wait for the price to reach the upper band of the indicator. Afterwards, watch out for a price rejection down. Once this happens, you can open a SELL/SHORT position if price action prints a bearish reversal candlestick pattern in the meantime. (e.g. bearish engulfing).
Conclusion
The ATR bands indicator is used to identify trends and volatility in the markets. It’s well worth using as you can use it to identify trend reversals, volatility, breakouts and more. The indicator is accessible to everyone and can be downloaded for free.
The Gann Square9 2 indicator for MetaTrader helps traders identify the market trend direction, as well as potential support and resistance moves. Places like this have been conditioned by some technical indicators like support and resistance points.
The zig-zag function of the indicator is used to identify the trend direction of the market while the support/resistance tool paints different lines that act as potential trend reversal zones.
The Gann SQ9 indicator will let you know the bias of a trend and potential price continuation/reposition zones. So it’s not hard to foresee a reaction from the market when the price approaches these points.
Furthermore, the indicator would be of great help to both novice and experienced traders alike. The indicator is perfect for different trading styles such as day or intra-day and swing trading.
The indicator comes with a gray line to show the trend start/end. It also has a gray line that can be used as an exit when trading. The white dotted line is the regular zig-zag – it just appears on this indicator. The green and red markers represent support (green) or resistance (red) levels, with corresponding prices.
BUY Signal: First, identify the trend direction with the zigzag tool. In this case, it is a bullish trend. Now, watch out for price rejection at any of the support levels, and then open a BUY/LONG position in sync with price action. (e.g. Hammer, bullish engulfing, etc.).
SELL Signal: Firstly, identify the trend direction with the zigzag tool. In this case, it’s bearish. Watch out for price rejection at any of the resistance levels and open a SELL/SHORT position after that happens (e.g. Inverted hammer, bearish engulfing, etc.).
Conclusion
The Gann SQ9 2 indicator is a forex trading tool that automatically identifies the trend direction and potential resistance & support levels of an asset. However, it is no cost to you!
The MT4 Currency Power indicator is a lightweight version of the currency strength meter. It calculates results quickly, utilizing few resources.
Furthermore, the indicator shows currency strength and helps traders decide on the strongest and weakest combinations of currencies.
Additionally, you can see the BUY and SELL status of various currencies on the current price chart. The colors allow forex traders to make informed decisions on when to buy or sell.
Forex traders can place the indicator on whatever time frame they want to, as it is independent of time frame. It works for new and experienced traders alike and should be used by people who are uncertain about their trading skills.
New traders can understand the strength of the currencies and identify the best currency pairs to buy & sell. Advanced forex traders can also use currency strengths to formulate advanced trading strategies.
Customers don’t need to pay to download the indicator – it’s available for free! Installing is simple and quick, too.
Conclusion
The MT4 currency power indicator can be used to identify the strongest and weakest pairs among currencies. The fact that it also allows traders to ‘play’ these pairs against each other is fantastic, effectively making any trader’s life easier.
Successful traders try to identify a trend early as possible and ride it till the end. Channel ZZ Indicator for MT4 is a perfect combination of channel and ZigZag trading technique.
This is a channel with the use of ZigZag
1) It measures the ZigZag price ranges.
2) Channels are always parallel and the ZigZag lines are always at equal distances.
3) When the price is within the channel, it shows a trend.
4) When the price leaves the channel, it shows a trend reversal.
The combination of indicators enables traders to identify a trend and ride it while reducing the market noise. The combination also helps you find the best entry and exit points and manage the stops. It will also allow you to ride the trend till the end
The three rules of trend following
1. In a trend, sell when the most recent highs are broken
2. In a trend, buy when the most recent lows are broken
3. When prices move sideways, do nothing
The indicator draws a channel based on the price movements and a zigzag based on the channel. Many forex technical trading systems use this indicator to plot other indicators.
Parameters
-Period: This is the period of the zigzag
-Length: This is the length of the zigzag
-Shift: This is the shift of the zigzag
-Shift Direction: This is the direction of the shift
-Direction: This is the direction in which the channel will be drawn.
However, the ZigZag indicator in MT4 draws zigzag patterns according to a channel. The combination of channel and zigzag can provide you with strong support & resistance level
This Moving Average indicator uses the Keltner Channel in addition to Jurik moving averages to produce powerful trend trading signals. If you are a forex trend trader, then this indicator is ideal for you.
The flexible parameters can help you tailor it to your needs and the insight provided for different strategies will help your trading.
The best trading strategy using Keltner Channel with Signals Indicator?
The best trading strategy using Keltner Channel with Signals Indicator is to buy when the price breaks out of the upper band (Keltner Channel) and sell when the price breaks out of the lower band. You can also place stop losses at those bands.
Jurik moving averages are a new way to calculate the standard moving average. Unlike the standard moving average, this method does not lag in order to produce a smoother line of data. This allows for a more accurate representation of the data and less noise.
The indicator generates a SELL signal if the Jurik Moving average changes color from Blue to Magenta. Furthermore, the price also should be lower than the midline and the lower line of the Keltner channel.
Alternatively, the indicator generates a BUY signal if the Jurik Moving average changes color from Magenta to Blue.
The Jurik Moving Average is calculated by taking the average of the last 5 days of trading prices for a given security or currency.
Example
Consider a down trend with a rally to the upside. As the trend continues to the downside, traders expect the lower lows.
The trader can place a Stop loss below the previous swing low or the lower Keltner channel line.
The indicator provide visual signals and supports both new and experienced traders to make decisions on trade opportunities in the current trend.
Warning
– Please be careful when using this indicator. It is not a “get rich quick” scheme.
– Please ensure that you fully understand the risks involved in trading before using this indicator.
The Auto Trend Lines Channels Indicator spots the peaks and bottoms of any market, no matter how volatile it may be. It connects all swinging areas so you can plot automatic trend lines with ease! This is perfect for beginners who depend heavily on trends but find drawing them manually difficult or time-consuming – as well as experts traders looking at multi charts every day
Traders looking for success in the market need not rely on luck alone. With just a few simple skills, traders can take advantage of Auto Trend Lines Channels Indicator and maximize their potential by understanding how prices are reacting within trendline areas – this is where these indicators shine!
– Pin bar signals show when stocks may reverse direction; inside bar breakouts indicate an upcoming move outside of two parallel lines (this has become less popular); false breaks appear as soon as there’s been heavy selling but no confirmed lower high/low yet
ZigZag AutoChannel is a combination price channel indicator and auto Zig_Zag. It can be used on the MT4 platform.
Market experts heavily use both ZigZag as well as price channel for technical analysis of forex currency pairs.The ZigZag indicator is used to identify market trends.A price channel, on the other hand shows the price’s hidden support or resistance based upon the market’s highs and lowers.
The ZigZag AutoChannel indicator’s primary purpose is to assist traders in finding the right trend and at the highest level possible for placing orders.You can also code your own MT4 ZigZag Expert_Advisor, (EA), based on the indicator’s trading rules.
Our review found that the ZigZag AutoChannel indicator allows for a simple demonstration and display of chart signals.It is also compatible with all timeframes on the MT4 platform.This flexibility allows you to use it for intraday and scalping trading.
Trades within the auto channel area
Buy: If the ZigZag line rises and the price bounces up from channel support
Sell when the ZigZag line falls and the price recovers downwards from channel resistance
Trades outside of the auto channel area
Buy when the ZigZag line rises and the price breaks through the channel resistance
Sell when the ZigZag line falls and the price breaches the channel support
Conclusion
The ZigZag AutoChannel indicator shows a balance between trend and level for assessing possible trade setups.It works with forex currency pairs as well as stocks, futures and cryptocurrency charts.It is compatible with MT4 ZigZag EA, which allows you to trade auto based on ZigZag trends.
Our review found that the ZigZag AutoChannel was one of the easiest and most effective trend-following trading tools available for beginners.
ATR Channels indicator falls under the umbrella of trend channel indicators.The price chart for a currency pairs displays multiple price channels. These price channels are plotted using moving mean and ATR values.
You can assign a specific price channel coefficient to the forex ATR Channels indicator settings, which allows you to expand or narrow each channel independently.
What is the ATR Channels indicator?
Naturally, market volatility has created an opportunity for channel strategies to be developed that take advantage of fluctuating markets.
The classical channel construction suffers from a major weakness: the channels remain static.ATR channels is an indicator that allows technical analysis to build multiple channels around a price.The dynamic value of the channel is determined by market volatility.
ATR channels is multicurrency instrument. Therefore, traders can choose a timeframe that suits their preferences.You can use ATR channels in any timeframe. This makes it easy to make the indicator part of both a scalping and long-term strategy.
The Donchian Channel indicator is an MT4 trend-following indicator.It’s used by traders to identify the beginning of new trend direction or breakouts in trading and trend following strategies.
The indicator offers the best entry points, but also allows for additional re-entry points in pullbacks.The channel width is wider in volatile markets than it is in low-volatility trading environments.The Donchian Channel Indicator is used by traders to measure volatility in the market.
This indicator is an integral part of trend-based forex trading EAs. It allows traders to automate it easily.The indicator is flexible enough to be used for any type of trading, including swing trading or scalping.Donchian Channel Idicator for MT4 available as a free download. It is also easy to set up.
Auto Trend Channel allows you to quickly and easily analyze trend movement in both the long- and short-term. This indicator can automatically plot channels to save you time and produce better results in trading.
The channel lines serve as channel boundaries but also act simultaneously as price levels. These channel lines are useful for trading pending orders. After installing the indicator, a price channel will be displayed on your terminal’s screen.
You have the option to change the visual settings if necessary. Also, the thickness of lines can be adjusted. It changes depending upon individual settings.
What is the Auto Trend Channel indicator?
Prices can change in the Trend Channel for different reasons. True and false breakdowns are different. True breakouts occur when the price moves within a channel for some time, and then breaks the resistance.
Transforming the resistance line to support is what confirms a true breakout. This is when the trader has to wait for a new price channel.
We can determine if the breakout was false or not by the formation of one or more candles after the channel is broken. If the price doesn’t return to the trend channel, it is a true breakout.
The trend channel is when the price moves beyond the resistance line during bullish trends or the support line during bearish. It is important to note that price channels’ boundaries are not always clear.
Most often, price movements show a breakout without confirmation. If this happens, the trader must use other confirmation signals.
Auto Trend Channel Indicator Strategy
Let’s take a look at trading strategies using the Auto Trend Channel indicator.
Auto Trend Channel buy set up
Wait for a clear breakout from the channel on its upside.
Wait for the bullish candle to appear after the breakout
Place the profit taker near the horizontal resistance
Place the stop loss a few points below the trend channel’s upper limit.
Auto Trend Channel sale
Keep an eye out for a clear breakout on the channel to the downside.
Wait until the bearish candle appears after the breakout
Place the take profit at the horizontal support
The stop-loss should be placed a few pips higher than the trend channel’s lower boundary.
Conclusion
Auto Trend Channel indicator makes it easier to create a channel on the chart.Automatic plotting of charts is possible.You can also create a trading strategy using the indicator.Before going live, however, you must test the strategy on historical data and a demo account.
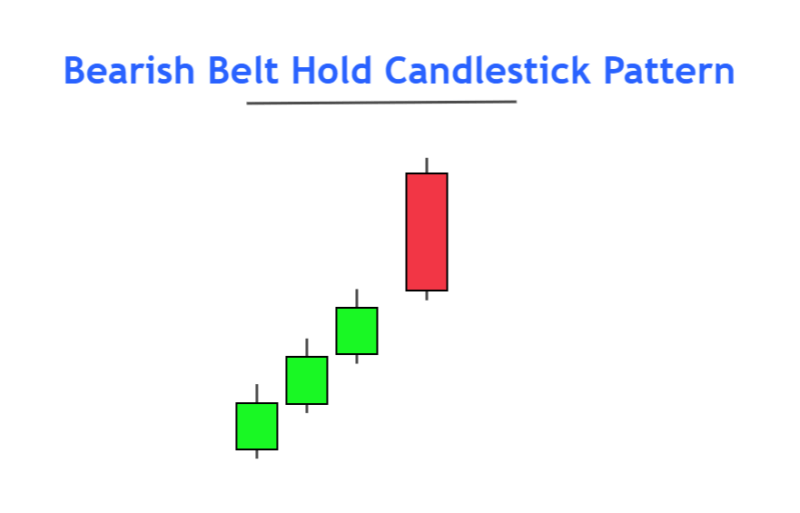
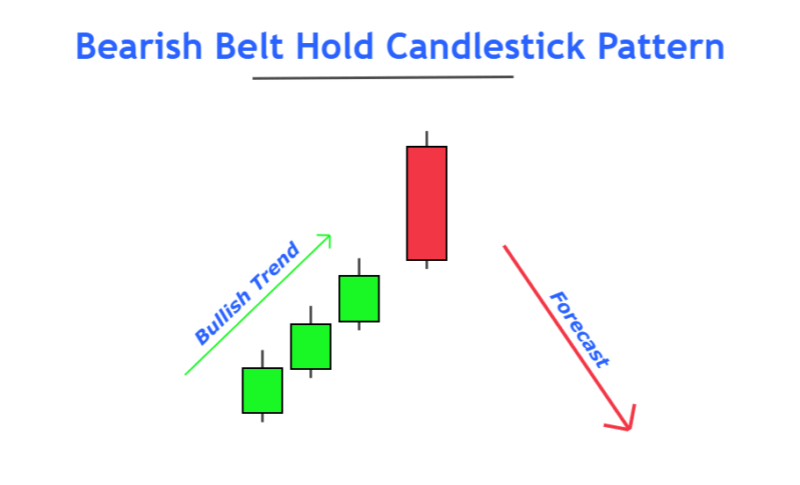
The trend reversal candlestick pattern Bearish Belt Hold is a form of trend reversal that transforms the bullish price trend into a bearish price trend . It forms at the top price chart and creates a long bearish candlestick, which results in a price trend reverse.
Because of the high volatility, the belt-hold price pattern works well in stocks and indices. However, there is very little chance of a belt hold pattern in major currency pairs.
How do I identify a bearish-belt hold?
These steps will show you how to spot a bearish Belt Hold Pattern on the price charts.
Three bullish candlesticks are expected to make higher highs and lower lows in the price chart.
A large bearish candlestick with a new high should be found at the top price chart. It should close within the range from the previous candlestick.
Three bullish candlesticks signify bullish trends. These candlesticks should not have large bodies as they indicate slow upward price trends.
The third point does not have to be taken for the belt holding pattern to work. It is used for identifying slow market trends. Because market reversals occur after a false breakout, overbought or oversold situations. These three candlesticks increase chances of trend reversal.
Bearish Belt hold: Information Table
Features
Explanation
Number of Candlesticks
4
Prediction
Bearish trend reversal
Prior Trend
Bullish trend
Counter Pattern
Bullish Belt Hold
What does a bearish pattern of a hold pattern tell traders about the market?
It is mandatory to know the reason for each candlestick formation you intend to trade. If you only know that belt hold is a reversal pattern, you won’t make the right trading decisions.
Because market conditions are not always ideal, there will be a variety of price patterns. You must be able to comprehend the logic behind every price pattern to deal with this situation.
Three candlesticks within the bearish Belt Hold Pattern signify that buyers control the market but are becoming weaker over time, and sellers are looking to sell. But after three consecutive bullish candlesticks it opens with a gap then engulfs it.
This gap is falsely called a breakout and captures the orders made by the buyers. The gap was closed by the price, and it closed within the same range as the previous bar.
Buyers were defeated. After an engulfment at a critical level, sellers started a new bearish tendency and now control the market. What does the bearish belt pattern reveal to traders? It is mandatory to know the reason for each candlestick pattern you trade.
Trading will not be easy if all you know is that belt hold can be described as a reversal pattern. Because the real market is not like ideal price patterns.
You need to understand the logic behind every price pattern to deal with this situation. Three candlesticks for the bearish Belt Hold Pattern show that buyers are still controlling the market, however, they are getting weaker over time and sellers may be preparing to sell.
However, after three consecutive bullish candlesticks, a huge bearish candlestick opens with an opening and then engulfs that gap. This false breakout is an order capture of the buyers.
Price filled the gap and closed within a range of the prior bar, defeating the buyers. After an important level of engulfment, sellers began a new bearish trend that is now dominating the market.
How to trade the bearish belt hold
Trades in candlestick patterns are always made with the help of other technical analysis tools. I will demonstrate how to trade bearish hold efficiently.
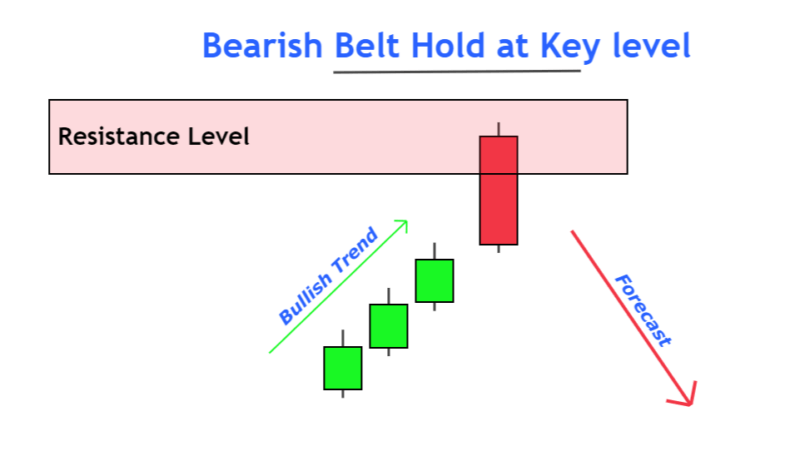
This strategy includes two confluences
Resistance or Supply Zone
Bearish belt hold
Open sell trade
Look for a strong resistance zone or supply area at the top of price swings. It is possible for the price trend to reverse from the resistance zone.
The trend reversal signal for bearish belt hold is also present. The probability of price trend reverse will increase if we combine the indicators.
Open a Sell Trade immediately after the Bearish Belt has formed.
Stop-loss level
The safe level of stop-loss is higher than the resistance zone. Stop-loss should be placed above the resistance area. If the high of a bearish candlestick is greater than the resistance zone, you can place a stop-loss higher than the candlestick.
Take-profit Level
Close 75% trades at 1:1 risk-reward. Next, hold on to the remaining trades until they reach 1:2 risk-reward.
Conclusion
This candlestick pattern is best when the following conditions are met. It is not a good idea to trade one candlestick pattern without considering other technical parameters like overbought conditions or oversold conditions.
Because the price structure is natural. Price patterns have their ups, downs. The best thing to do is analyze the price swings of the chart and then trade according to confluences, such as bearish belt-hold patterns.
The best Metatrader indicator is the Auto channel indicator for MT4. It draws an equidistant channel instantly. Furthermore, it displays the slope of each channel to indicate BULLISH or BEARISH conditions.
The channels act as support and resistance, and offer the best entry points. The indicator has a good risk-reward ratio because the stop loss is usually small in comparison to the take-profit.
For new forex traders, drawing an equidistant chart automatically is extremely useful. Also, new forex traders often have difficulty plotting them.
The support and resistance provided for by the Auto Channel indicator for MT4 helps the traders. On the other side, advanced forex traders can include ascending or descending channels in any type of technical trading strategy.
For advanced traders, the indicator can be used to trade trend and counter-trend trading strategies. FX traders can also download the indicator free of charge.
Auto Channel Mt4 IndicatorSignals
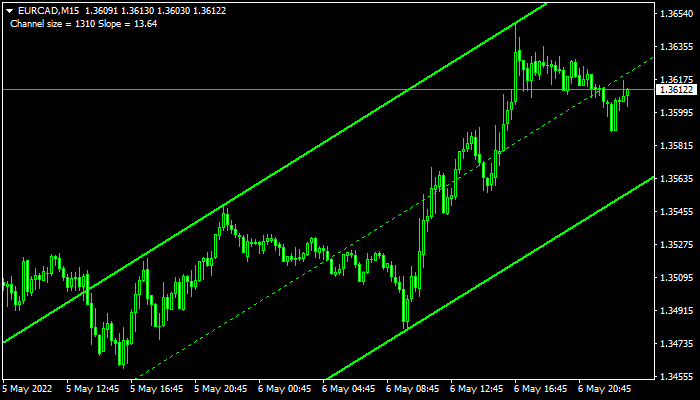
The EURCAD M15 chart depicts the Auto Channel Indicator for MT4 working in action. It plots outer channel lines as GREEN and midline lines as dotted GREEN. When the price touches these lines, the indicator plots a RED line. Moreover the chart also displays the channel size and slope as comments.
Forex traders can place BUY trades at the lower channel if there is an ascending channel. This channel acts as support and signals a BULLISH Market. Forex traders can also place a stop loss at the lower channel below the swing low to target profit targets at the next resistance.
As a BEARISH trend, forex traders are able to trade SELL positions at either the top or bottom of a descending channel.The best entry point is at the top which also acts as s resistance.Forex traders have the option to place Stop-loss at the top and target a take profit target at a support level below the previous high.
A reversal candle should accompany all entry points to confirm price action.A bullish candle should be used for a buy signal. Conversely, a bearish candle should be used for a sell signal.
This indicator can be used on intraday, daily, weekly, or monthly charts.Price action can be used to confirm the BUY AND SELL signals.
Conclusion
The Auto Channel Indicator MT4 should be a permanent tool in any technical forex trader’s arsenal.The indicator automatically draws channels which show the BEARISH/BULLISH market conditions.
It also automatically provides support and resistance that double as profit targets in this technical trade strategy.Easy to use and free to download, the indicator also makes it easy to install.
The commodity channel indicator (CCI), one of the most popular indicators for forex trading, is used to detect potential trend reverses and divergence between currency prices and their statistical mean price over time. In other words it shows the weakest periods and turning points in the market.
Also, the oscillator can help determine whether the asset pair has overbought/oversold. The index value ranges from +100 to -100. If the indicator exceeds the +100 value it indicates that the price is in an overbought zone. A -100 indicates that the price is oversold.
A market that is excessively overbought is one where the price has experienced an unusually long run. Therefore, sellers will likely take control of the market and close any winning trades.
This indicator is used to determine divergence. For example, if the price reaches a new maximum deviation, it means that a trend reverse is imminent.
The commodity channel indicator for mt4 is a useful tool for new and experienced forex traders. For beginners, it helps identify optimal entry and exit levels. Seasoned traders, however, can use this indicator to spot divergences.
Remember that the CCI indicator MT4 is not bound. This means it does not have fixed high and low values. It is therefore important to be cautious when identifying areas of overbought or underbought. Usually, the overbought/overbought zones are set at 100 and –100.
Buy and Sell Signals Commodity Channel Index
The centerline represents a neutral or zero point.The zone above the 0 line represents a buy territory and the area below it is a selling area.You should look for buy opportunities.You should expect a price reverse when the price crosses into an overbought or oversold zone.
The overbought zone indicates a strong uptrend.You should be ready to exit when the candlestick or reversal pattern appears.
Conclusion
The indicator of the commodity channel is a good oscillator for identifying buy and sell opportunities.It can tell you whether to follow the trend when there is strong momentum or prepare for a trend reversal.CCI, just like other indicators, should always be used in conjunction to identify market entry positions and establish confluence.
Trend channels are a popular way to predict prices and help traders identify potential support or resistance zones. However, an Automatic Channel indicator can solve the problem.
What’s the Automatic Channel indicator?
Trend channels show the strength and duration of a trend. Traders draw the channel using either the trendlines or the equidistant feature on a trading platform. However, there is another type of channel that draws five parallel lines directly onto your chart.
The Automatic Channel indicator shows a wide channel with an interior channel. A mid-line intersects the boundaries of the broad channel at the center.
These parallel lines can act as support or resistance zones, depending on the relative price position. A trend is considered mature and near to reversal if it reaches the channel boundary.
conclusion
To help you locate potential support or resistance zones, the Automatic Channel indicator draws five parallel lines across your chart.These lines can be used to enter and exit your positions.The indicator is very useful, but it should not be blindly used.To increase your win rate, you should use it with other trend tools.
The combination of moving averages makes up the SSL Channel Chart Alert indicator for MT4. The SSL stands for Semaphore Signal Level. It provides visual BUY/SELL trading signals.
The indicator gives you BULLISH or BEARISH trend signals depending on the intersection of the indicator lines. It is very useful for forex traders who use trend trading as a technical strategy.
The indicator doesn’t repaint so new forex traders can use it to receive alerts when the lines cross. The BUY and Sell signals are easy to understand.
The trend signals are useful in understanding the BULLISH or BEARISH market conditions. For advanced forex traders, it is possible to combine momentum indicators and oscillators to confirm trading signals and trade with confluence. The indicator is easy to download and install.
SSL Channel Chart Alert Mt4 Indicator Signals
This indicator displays the BULLISH/BEARISH trends in RED lines and GREEN lines.
Technical Forex traders can open a BUY trade once the GREEN line crosses the RED line upwards. The best stop loss is the previous swing low.
While the profit target is the opposite signal, This technical trading strategy uses the GREEN line to indicate a BEARISH trend. Forex traders can then place an SELL trade using a stop loss at the swing high. The profit target is at either the opposite signal or if there is a good risk/reward ratio.
The SSL Channel Chart Alert indicator for MT4 applies to all intraday timeframes as well as long-term timeframes such as daily, weekly, and monthly charts. However, signals generated in lower timeframes are not likely to signal a trend, so forex traders should use this technical trading strategy.
Forex traders should use multi-timeframes (mtf) to trade with a top-down approach. Higher timeframes are used by forex traders to identify larger trends, while lower time frames zero in on the best entry points.
Conclusion
The SSL Channel Chart Alert indicator for MT4 uses moving averages to generate an alert signal. This allows forex traders to trade the BUY or SELL signals easily in their auto trading forex strategies.
Raff Channel indicator for MT4 draws a chart with the midline representing the first-order regression. The upper and lower lines act as support and resistance.
Any price movement beyond the channel or at channel lines is a sign of a reversal. Channel extremes are the best entry points to a BUY/SELL trade. But, a sustained breakout indicates a market trend reversal.
This indicator is easy to use and can be traded by both novice and experienced traders. It works on all intraday timeframes and daily, weekly and monthly charts. However, it may also be used to trade multi-timeframe forex trading strategies (mtf).
Raff Channel Mt4 Indicator Signals
Conclusion
The Raff Channel indicator for MT4 can be used as a standalone trend-trading indicator.The best entry points are at extremes, so it only provides few trades that are successful and efficient.Traders can use additional indicators to confirm the BULLISH/BEARISH trend over higher time frames.You can also download the indicator for free and install it easily.
The PChannel Indicator MT4 is based upon the highest high or lowest low of the previous bars of indicator input. A Price Channel, which is the highest or lowest value of an indicator’s input, is plotted by this indicator. It is dynamically changing.
The channel lines are affected by changes in the values of the highest low and lowest low. As a result, channel levels give forex traders BULLISH and BEARISH trend direction. They also provide BUY signals and SELL signals. A channel breakout can cause reversal signals.
This Metatrader indicator must be confirmed with price action. New and experienced forex traders can use this indicator in any forex trading strategy. The indicator is also free to download and is easy to install.
PChannelMT4IndicatorSignals
The EURUSD M30 chart shows the PChannel Indiator for MT4 working in action. The upper price channel has been plotted using BLUE and the lower in RED.
An extended break out at the upper price channel is a sign of a breakout and a BUY signal. Forex traders have the option to place a stop loss at lower channels with take profits levels at a high risk/reward ratio.
You can also sell if a lower price channel breakout occurs. For this type of technical trading strategy, the best stop loss is in the upper channel.
Any reversal signal, however, is a signal to enter a trade in the opposing direction if the channel is not broken. In such cases, the channel acts as support or resistance lines.
Best practice is to confirm reversal trading signals with price action. Higher trading volumes will make reversal points stronger near-established support and resistance zones, trendlines, or support lines.
The PChannel indicator is used for MT4 to aid forex traders in identifying market trends. A flat channel is a market that moves in one direction, while a price movement below the lower channel indicates a BEARISH trend.
Contrary to popular belief, a BULLISH price trend is indicated by a price move above the upper channel.
This Metatrader indicator can be used in both intraday charts and longer time frames, such as the weekly, monthly, and daily charts.
Multi-time frame traders (mtf) will find it extremely useful as it reflects trends in higher time frames. It also allows forex technical traders to locate the best entry point in a shorter timeframe.
Conclusion
The PChannel indicator MT4 is a shorter form of the Price channel.This indicator uses only the highest high or lowest low formula.It provides an easy and efficient price-based trading strategy.Forex traders can also download the indicator free of charge and install it quickly.
The Standard Deviation Channel Indiator for MT4 allows you to plot channels automatically on your price chart based on the price’s normal deviation. The indicator also shows support and resistance.
This indicator is suitable for advanced forex traders as well as new traders. It shows the BULLISH BEARISH market trend and provides SUPPORT and RESISTANCE levels.
Standard DeviationChannel Mt4IndicatorSignals
The XAUDUSD H1 chart above shows the Standard Deviation Channel indicator for MT4 in action. The indicator displays the MID channel as a DEEPSKYBLUE color dotted line, while the INNER AND OUTER channels lines are displayed as normal DEEPSKYBLUE color lines.
Channel lines are SUPPORT and RESISTANCE levels. The inner and outer channels levels are best-suited for BUY and SEL entry positions.
Forex traders consider the price to have been BULLISH if it goes above the midchannel line of the Standard Deviation Channel indicator for MT4.
Contrarily, the price moves into a BEARISH channel if it falls below the mid-channel. Forex traders can BUY if they see a price rise from a lower channel and crosses the midline.
Forex traders can also have SELL positions if the price closes below a mid-channel line on the Standard Deviation Channel indicator for Metatrader. At the same, they can target the lower channel to take profit or stop loss at the higher channel.
For the best forex trading results, aggressive forex traders can place BUY orders once the price reaches the outer lower channel.
Technical traders can also initiate SELL trades at the outer upper channel. However, traders should be aware of the intraday support and resistance levels, price action, trading volume, as well as intraday support and resistance levels.
Conclusion
The Standard Deviation Indicator MT4 for Forex Trades is the best tool to automatically create a channel, eliminating any trader’s discretion.
Thus, the forex trader is able to determine the support levels and resistance levels mathematically. This acts as the best entry points and exit points.It works with intraday charts and daily, weekly, or monthly charts.It is free to download and can be easily installed by forex traders.
The Price Channel indicator can be used to determine the price oscillations of an asset between three parallel lines. These lines could be horizontal, ascending, and descending.
This indicator can be used to identify breakouts. A breakout is when a currency pairs’ price crosses either the upper or lower channel.
We’ll be discussing all the unique aspects and nuances of this indicator in this guide.
What is a Price Channel indicator and how does it work?
Based on price breakouts, the indicator suggests possible signals. These are the Upper-PriceChannel or Lower-PriceChannel.
The Upper Price Channel’s highest price is for a specific period. A Lower Price Channel’s lowest price is for a similar period.
The time for these channels is 14.
This indicator calculates the highest and lowest prices within a price range.
The middle trendline acts as a balance between the upper channel and the lower channel.
Bollinger bands and Average True Range are not indicators that this indicator can compare to. The indicator measures the difference between Lowest Low (lowest) and Highest High (highest). This is why it connects with likely regions of support/resistance.
Bollinger band and Average True Range tend to narrow during periods of sideways movement, price consolidation, and generally before a breakout.
Indicator can be used for two purposes.
For channel trading methods, identify support and resistance levels
You can spot price breakouts when prices close above or below the Upper Price Channel.
How to use the indicator
The indicator draws the lower trendline if the price pivots higher. Conversely, the indicator draws the upper trendline if the price pivots lower. The magnitude and direction of the inclines, dips, and the volume determine the trend.
An ascending channel is defined as a trendline with positive slopes, which indicates that the market is rising higher.
The trendlines that indicate a falling or downward price channel have a slope with a negative slope. This indicates that the price is moving lower with each price move.
Two lines in a price channel represent support and opposition. Signals can be generated using these lines to make trades.
Price Channel indicator trading strategy
There are several ways to profit from the indicator. You will have the best chance to win when the price channel is clearly defined.
Buysetup
Price should be above the upper channel
Wait for confirmation candles to appear
Please enter at the confirmation candle
You can place a stop loss near the latest low
You can exit if the price falls below that channel’s upper limit
Sell setup
Price should close below lower channel
Wait for the confirmation candle to come on.
Enter at the confirmation candle
Stop-loss placed at the top of the most recent high
When the price rises to the top channel, exit
Conclusion
The indicator allows you take advantage of the price bounce between support and resistance lines.It helps identify breakouts.
Combining the indicator with another indicator will confirm the price trend.
Trend trading is the most profitable forex trading strategy. Markets move in trends, creating swing highs/lows in all time frames. Therefore, forex traders follow trends by identifying swing lows and highs.
Forex strategies and indicators can help traders identify trade trends. These strategies and indicator may seem confusing or difficult to comprehend, especially for newbies. However, the Channel Signal Indicators (MT4) help traders easily identify trends.
The Foundation
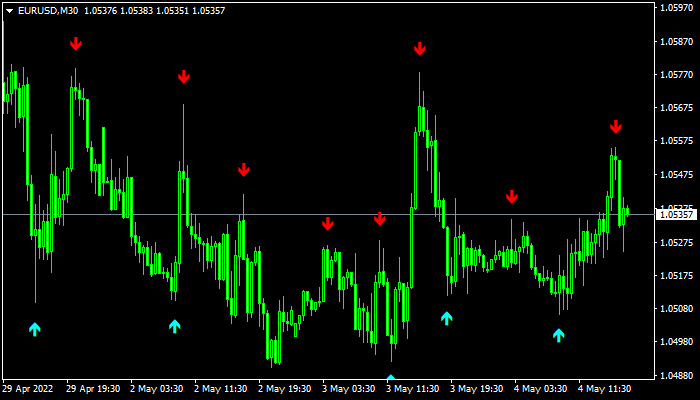
The Channel Signal indicator helps forex traders identify trends and determine when they should enter and exit trades. It shows swing highs or lows which makes it easy for traders to see when the market is in an upward or downward trend.
Below is the Channel Signal Indicator chart for the EUR/USD M30 chart.
On the chart, you can see that the red colored arrows indicate a downtrend and signal sell trades. It simply means that the bullish run is over and that a bear market has started.
Therefore, the aqua colored arrows on the chart signify the start of an uptrend.
This indicator is perfect for all time frames (from 5 mins to monthly timeframes). You can profitably use it as a scaler, swing trader, or position trader.
This indicator is also suitable for all market conditions. It can be used to identify support levels and resistance levels by range traders. Trend traders can also use the indicator to identify dynamic support zones and resistance areas.
Conclusion
Channel Signal Indicator MT4 assists traders in identifying trading channels and where to enter or exit trades. It works under all conditions and timeframes.
This indicator can be used by itself, but it is better to use it in conjunction with price action or market structure analysis.
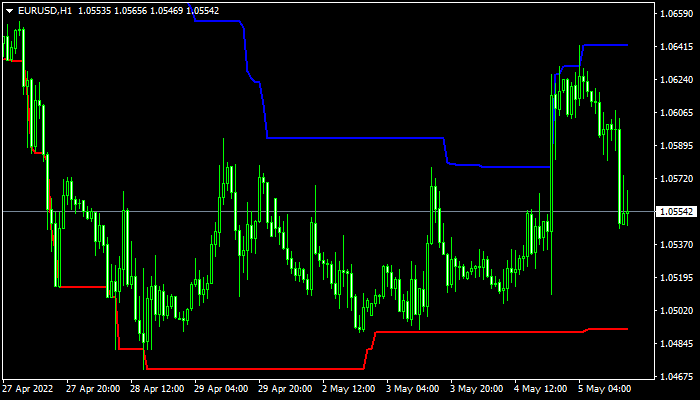
The Daily HL indicator for MT4 calculates HIGH and LOW prices and displays them in the current charts. Forex traders that use high and low to calculate entry points and exit points can get the most out of this indicator.
Furthermore, it can be used as a trend indicator since the indicator plots the highs and lows as a continuous line.
Both novice and professional forex traders can use the indicator. The indicator is compatible with all time frames. The indicator also works well on daily, weekly, monthly and monthly charts.
For best results, however, the indicator should be used in conjunction with other indicators and price action to confirm entry signals.
Daily H-L Mt4 Indicator Signals
The EURUSD M30 chart shown above shows the DailyH-L indicator of MT4 in action. It plots the high in LIME, and the low (in RED) as a continuousline. Furthermore, it can calculate the high or low for any time frame and plot it on the current chart.
Forex traders who use a daily high-low trading strategy can BUY when prices reach the daily low. In this case, the daily Low acts like a support and gives the trader an entry point to place a trade.
The market will have the ability to fluctuate but the stop loss is the lowest. On the other side, the daily HIGH offers the best possible take profit positions.
If the price moves from the daily HIGH forex traders may enter a SELL position. Because the high acts like resistance, this position can be held until the position reaches the daily LOW. It will be the best exit to book profits.
Forex traders also have the option of using the HIGH and LOW indicators to help them identify the trend direction. If the price keeps breaking the lows, this indicates a strong BEARISH market trend.
However, if prices keep breaking the HIGH, then it is indicating that the predominant BULLISH tendencies are strong.
The Daily HL indicator for MT4 is able to be used to trade multi time frames (mtf). Trends in higher time frames tend to last longer. Forex traders can then identify the trend and enter the market within a shorter time frame.
Conclusion
The Daily HL indicator for MT4 is a good choice for forex traders using the BUY AT LOWS and SELL AT HIGH forex trading strategy. Additionally, the indicator can be downloaded free of charge and installed easily.